We’ve all done it at one point or another. Our application throws an exception and we start wading through a standard Windows error dialog or a log file to examine the exception and stack trace. If you’re a ReSharper Jedi, you’ve probably copied the exception and stack trace to the clipboard and hit CTRL-SHIFT-E (IDEA) or CTRL-E, T (VS) in Visual Studio to launch ReSharper’s Stack Trace Explorer. (If you have’t, you’ll see the Stack Trace Explorer in just a second.)
Let me show you an easier way that works well on desktop or Silverlight apps. I’ll use Silverlight for demo purposes, but the same technique works with WPF and WinForms. First we need to hook up a global error handler:
public MainPage() {
    InitializeComponent();
    Application.Current.UnhandledException += HandleApplicationUnhandledException;
}

private static void HandleApplicationUnhandledException(object sender, ApplicationUnhandledExceptionEventArgs e) {
    if(Debugger.IsAttached) {
        Clipboard.SetText(e.ExceptionObject.ToString());
    }
    e.Handled = false;
}
Please note that this is demo code and I’m simply hooking this up in the code behind. In a larger application, I would typically publish an ErrorOccurred message to my application’s message bus and register a listener that would contain the code in HandleApplicationUnhandledException.
Notice that I’m checking whether a debugger is attached. If so, I place the contents of the System.Exception (or derived exception) on the clipboard. (Clipboard is in the System.Windows namespace for Silverlight and WPF apps, but there is an identically-named class in System.Windows.Forms.) The reason that I’m checking whether a debugger is attached is so that end-users don’t get the clipboards spammed with exception text. You could conditionally compile the code so that production builds don’t contain it, but personally I like having the code in production too. It means that I can grab an old build, attach a debugger, and get the same exceptions that the end users are getting.
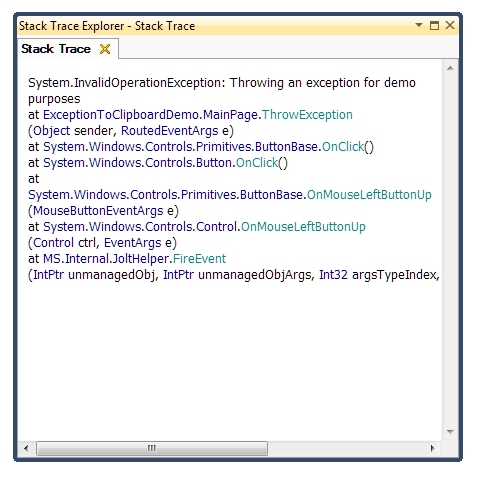
Now that the exception and stack trace is on the clipboard, I jump over to Visual Studio and press CTRL-SHIFT-E (IDEA) or CTRL-E, T (VS). I am immediately presented with ReSharper’s Stack Trace Explorer as ReSharper is smart enough to grab the current clipboard contents to display:

The advantage here is fictionless debugging as you no longer have to find, select, and copy the exception and stack trace to the clipboard. It’s there for you automatically. As soon as you hit an exception, simply jump to Visual Studio and press CTRL-SHIFT-E (IDEA) or CTRL-E, T (VS) and you’re ready to find the problem. Also note that all the method names in the ReSharper’s Stack Trace Explorer are hot links to the appropriate code file allowing for easy navigation of your code base, the .NET Framework, and third-party libraries.
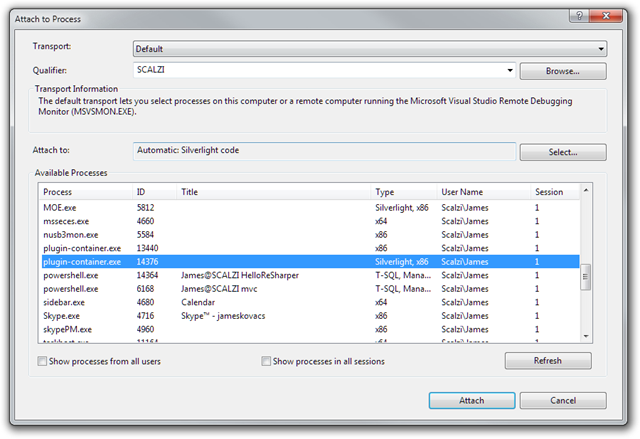
One quick note regarding Silverlight… Many modern browsers (e.g. FF4, IE8+, Chrome, …) will run Silverlight in a separate process. So even when you launch with debugging (F5), you’ll be attached to the browser process itself and not the child process that is hosting Silverlight. To correct this, simply go to Debug… Attach to Process… and find the hosting process where the type is Silverlight. (For FireFox 4, the hosting process is called plugin-container.exe. For IE8+ and Chrome, the hosting process is called iexplore.exe or chrome.exe, respectively. Just look for the one hosting Silverlight as noted under the “Type” column.)
Happy Debugging!
